


 29 / 136

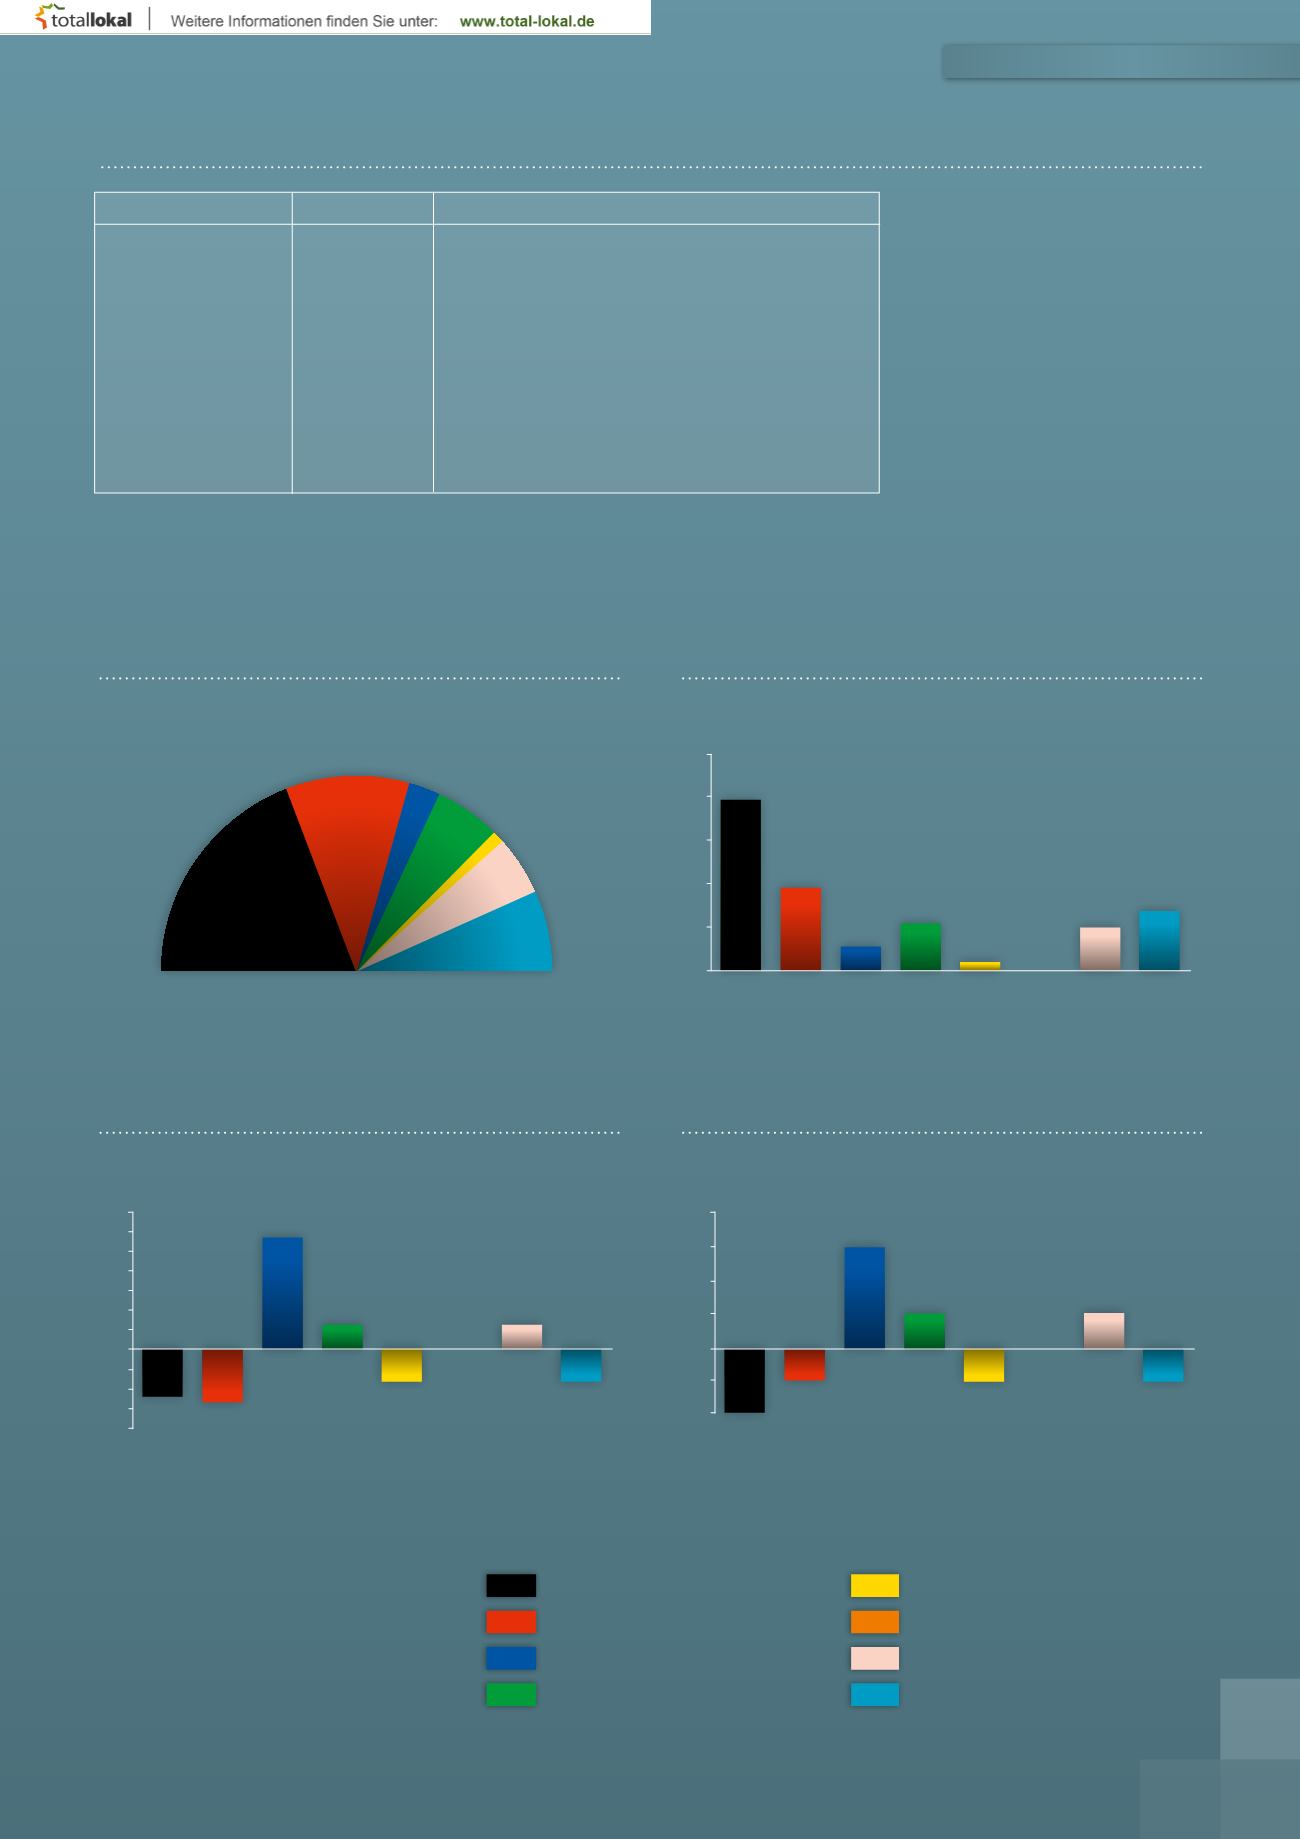
DIE KREISRÄTE 2014 - 2020
Ergebnis der Wahl des Kreistages vom 16. März 2014:
Wahlberechtigte:
104.121
Wähler:
64.614
Wahlbeteiligung:
62,1 %
Gültige Stimmzettel:
62.299
Ungültige Stimmzettel:
2.315
Gültige Stimmen:
3.236.143
Partei
Stimmen
Prozent
Sitze
CSU
1253.236
24.126
38,7
23
-2,2
-2
SPD
621.745
11.969
19,2
12
-2,8
-1
FREIE WÄHLER*
188.343
3.626
5,8
3
+5,8
+3
GRÜNE
352.698
6.790
10,9
7
+1,3
+1
Bürger für den Lkr
443.252
8.533
13,7
8
-1,8
-1
UNABHÄNGIGE/ÖDP
216.160
4.161
6,7
4
+0,2
-
FDP
58.156
1.120
1,8
1
-1,7
-1
REP
9.054
174
0,3
-
-1,7
-1
BP
93.499
1.800
2,9
2
+2,9
+2
CSU / CSU und andere
SPD / SPD und andere
FREIE WÄHLER
*
/ FREIE WÄHLER
*
und andere
Grüne / Grüne und andere
FDP / FDP und andere
ÖDP / ÖDP und andere
sonstige Parteien und gemeinsame Wahlvorschläge
Wählergruppen
27
Sitzverteilung
Sitzverteilung in %
Wahlergebnis
Sitzverteilung
50
40
30
20
10
-
7
6
5
4
3
2
1
0
-1
-2
-3
-4
4
3
2
1
0
-1
-2
38,7
-2,2
-2
%
CSU / CSU und
andere
CSU / CSU und
andere
CSU / CSU und
andere
SPD / SPD und
andere
SPD / SPD und
andere
SPD / SPD und
andere
FW / FW und
andere
FW / FW und
andere
FW / FW und
andere
Grüne / Grüne
und andere
Grüne / Grüne
und andere
Grüne / Grüne
und andere
FDP / FDP und
andere
FDP / FDP und
andere
FDP / FDP und
andere
ÖDP / ÖDP
und andere
ÖDP / ÖDP
und andere
ÖDP / ÖDP
und andere
sonstige
Parteien
und gem.
Wahlvorschl.
sonstige
Parteien
und gem.
Wahlvorschl.
sonstige
Parteien
und gem.
Wahlvorschl.
Wähler-
gruppen
Wähler-
gruppen
Wähler-
gruppen
19,2
-2,8
-1
5,8
+5,8
+3
%-P.
Sitze
10,9
+1,3
+1
1,8
-1,7
-1
0
0
0
9,8
+1,3
+1
13,7
-1,8
-1
Sitze insgesamt 60
23
12
2
8
1
6
8
*
Betrifft die Landesvereinigung FREIE WÄHLER Bayern